Difference between revisions of "User:Tohline/SSC/FreeEnergy/Equilibrium Sequence Instabilities"
(Begin chapter titled "Instabilities Associated with Equilibrium Sequence Turning Points") |
(Begin tossing together figures illustrating Bonnor-Ebert sphere turning point) |
||
| Line 1: | Line 1: | ||
__FORCETOC__ | __FORCETOC__ | ||
= | =Instabilities Associated with Equilibrium Sequence Turning Points= | ||
The discussion presented here is supported by detailed reviews and new derivations presented in the following associated chapters: | |||
* A [[User:Tohline/SSC/FreeEnergy/PolytropesEmbedded#Free-Energy_Synopsis| free-energy synopsis]]. | |||
* Material associated with an [[User:Tohline/SSC/FreeEnergy/PowerPoint#Supporting_Derivations_for_Free-Energy_PowerPoint_Presentation|overarching PowerPoint presentation]]. | |||
{{LSU_HBook_header}} | {{LSU_HBook_header}} | ||
== | ==Introduction== | ||
===Bonnor-Ebert Sphere=== | |||
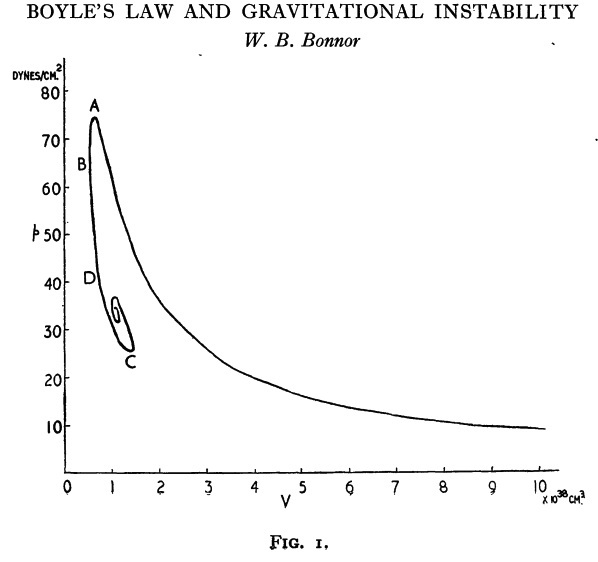
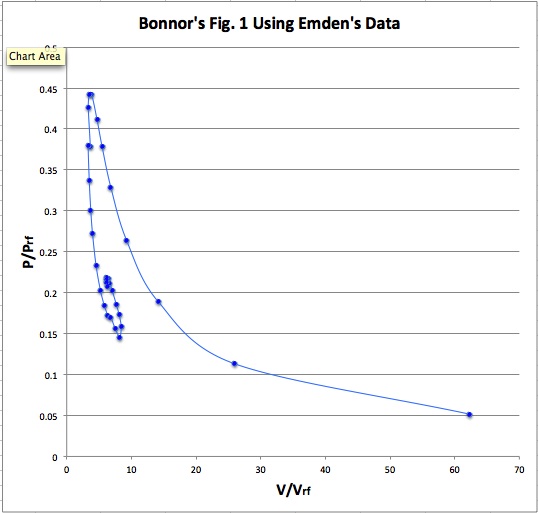
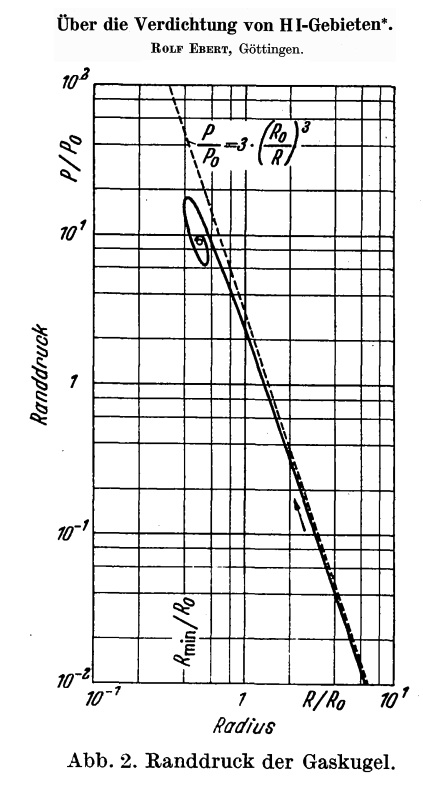
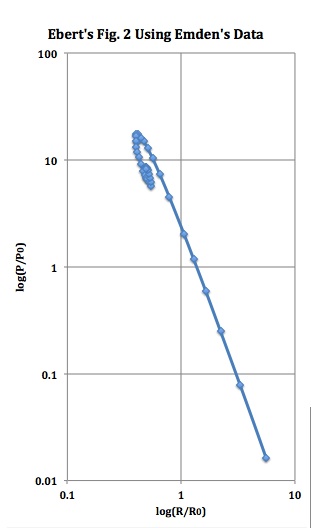
[http://adsabs.harvard.edu/abs/1955ZA.....37..217E Ebert] (1955) and [http://adsabs.harvard.edu/abs/1956MNRAS.116..351B Bonnor] (1956) are credited with constructing the first such models and, most significantly, discovering that, for any specified sound speed and applied external pressure, there is a mass above which no equilibrium configuration exists. | |||
<div align="center"> | |||
<table border="1"> | |||
<tr> | |||
<td align="center" colspan="2"> | |||
'''Figure 1: Bonnor's P-V Diagram''' | |||
</td> | |||
</tr> | |||
<tr> | |||
<td align="center"> | |||
[[File:Bonnor1956Fig1reproduced.jpg|400px|center|Bonnor (1956, MNRAS, 116, 351)]] | |||
<!-- [[Image:AAAwaiting01.png|400px|center|Bonnor (1956, MNRAS, 116, 351)]] --> | |||
</td> | |||
<td align="center"> | |||
[[File:BonnorFig1usingEmdenData.jpg|400px|center|P-V Diagram Using Emden's (1907) data]] | |||
</td> | |||
</tr> | |||
</table> | |||
</div> | |||
<div align="center"> | |||
<table border="1"> | |||
<tr> | |||
<td align="center" colspan="3"> | |||
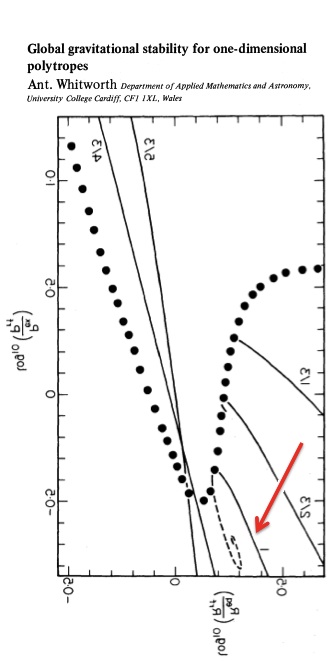
'''Figure 2: Ebert's and Whitworth's P-R Diagrams''' | |||
</td> | |||
</tr> | |||
<tr> | |||
<td align="center"> | |||
[[File:EbertFig2Title.jpg|250px|center|Ebert (1955) Figure 2]] | |||
<!-- [[Image:AAAwaiting01.png|250px|center|Ebert (1955) Figure 2]] --> | |||
</td> | |||
<td align="center"> | |||
[[File:EbertFig2UsingEmdenData2.jpg|250px|center|P-R Diagram Using Emden's (1907) data]] | |||
</td> | |||
<td align="center"> | |||
[[File:WhitworthFig1bFlipped.jpg|250px|center|Whitworth (1981) Figure 1b]] | |||
<!-- [[Image:AAAwaiting01.png|250px|center|Whitworth (1981) Figure 1b]] --> | |||
</td> | |||
</tr> | |||
</table> | |||
</div> | |||
<!-- | |||
====Coincidence Between Points of Secular and Dynamical Instability==== | ====Coincidence Between Points of Secular and Dynamical Instability==== | ||
From the [[User:Tohline/SSC/Structure/BiPolytropes/Analytic5_1#Model_Sequences|accompanying graphical display of equilibrium sequences]], it seems that a <math>~\nu_\mathrm{max}</math> turning point will only exist in five-one bipolytropes for <math>~\mu_e/\mu_c</math> less than some value — call it, <math>~(\mu_e/\mu_c)_\mathrm{begin}</math> — which is less than but approximately equal to <math>~\tfrac{1}{3}</math>. As we move along any sequence for which <math>~\mu_e/\mu_c < (\mu_e/\mu_c)_\mathrm{begin}</math>, in the direction of increasing <math>~\ell_i</math>, it is fair to ask whether the system becomes dynamically unstable (at <math>~[x_\mathrm{eq}]_\mathrm{crit}</math>) before or after it encounters the point of secular instability marked by <math>~\nu_\mathrm{max}</math>. | From the [[User:Tohline/SSC/Structure/BiPolytropes/Analytic5_1#Model_Sequences|accompanying graphical display of equilibrium sequences]], it seems that a <math>~\nu_\mathrm{max}</math> turning point will only exist in five-one bipolytropes for <math>~\mu_e/\mu_c</math> less than some value — call it, <math>~(\mu_e/\mu_c)_\mathrm{begin}</math> — which is less than but approximately equal to <math>~\tfrac{1}{3}</math>. As we move along any sequence for which <math>~\mu_e/\mu_c < (\mu_e/\mu_c)_\mathrm{begin}</math>, in the direction of increasing <math>~\ell_i</math>, it is fair to ask whether the system becomes dynamically unstable (at <math>~[x_\mathrm{eq}]_\mathrm{crit}</math>) before or after it encounters the point of secular instability marked by <math>~\nu_\mathrm{max}</math>. | ||
--> | |||
{{LSU_HBook_footer}} | {{LSU_HBook_footer}} | ||
Revision as of 17:30, 24 September 2016
Instabilities Associated with Equilibrium Sequence Turning Points
The discussion presented here is supported by detailed reviews and new derivations presented in the following associated chapters:
- A free-energy synopsis.
- Material associated with an overarching PowerPoint presentation.

|
|---|
| | Tiled Menu | Tables of Content | Banner Video | Tohline Home Page | |
Introduction
Bonnor-Ebert Sphere
Ebert (1955) and Bonnor (1956) are credited with constructing the first such models and, most significantly, discovering that, for any specified sound speed and applied external pressure, there is a mass above which no equilibrium configuration exists.

|
|---|
|
© 2014 - 2021 by Joel E. Tohline |
