Control Flow in VisTrails
Scientific workflows usually follow a dataflow model, but, in some cases,
control structures, including loops and conditionals, are necessary to
accomplish certain tasks. VisTrails provides the Control Flow
package to support these and other structures. To create your own Control Flow modules, please refer to the Developer’s Guide (Creating a Control Flow Loop Module). Or, if you would like to use the Control Flow Assistant, to simplify the process described in this chapter, please refer to The Control Flow Assistant.
This package also provides some related modules that operate on lists.
The Map operator
In functional programming, map is a high-order function that applies
a given function to a list (each element of the list is processed using this
function) and returns a sequence of results. The Map module
provides this functionality for workflows in VisTrails. Note that this
module provides simple looping as it can be used to iterate through a list
of inputs.
The Map module has four input ports:
- “FunctionPort”: this port receives the module (via the “self” output port) that represents the function to be applied for each element of the input list; if the function uses more than one module, you must use a
Group(see Chapter Groups and Subworkflows) or aSubWorkflowand connect that composite module to this port; - “InputPort”: this port receives a list of the names of the input ports that represent the individual arguments of the function;
- “OutputPort”: this port receives the name of the output port that represents the individual result of the function;
- “InputList”: this port receives the input list for the loop; it must be a list of tuples if more than one function input port was chosen.
The output port “Result” produces a list of results, one for each element in the input list.
Try it Now!
To better show how to use the Map module, let’s use a workflow as
an example. Inside the “examples” directory of the VisTrails
distribution, open the “triangle_area.vt” vistrail. Now, select the
“Surface Area” version. This version basically calculates the area
of a given isosurface. We are going to modify this version, in order to
calculate the areas of the isosurface given by contour values in a list.
Then, we will create a 2D plot to show all the areas.
Begin by deleting the StandardOutput modules, and the connection between the vtkDataSetReader and the vtkContourFilter modules. Then, drag the following modules to the canvas:
MapCartesianProductList(under “Basic Modules”)MplSource(under “matplotlib”)MplFigure(under “matplotlib”)MplFigureCell(under “matplotlib”)InputPort(under “Basic Modules”) - you will need two of themOutputPort(under “Basic Modules”)PythonSource(under “Basic Modules”)
Notice that when you drag Map to the pipeline canvas it will be drawn in a different shape from the other modules. This is a visual cue to help distinguish control modules from other modules. All control modules have the same shape.
Next Step!
Select the vtkContourFilter module and delete its method “SetValue” in the Module Information tab. Then, make this port visible by clicking on the first column left of its name in the “inputs” tab to toggle the eye icon..
Connect the modules as shown in Figure Connecting a subset of the modules to be grouped as a SubWorkflow.
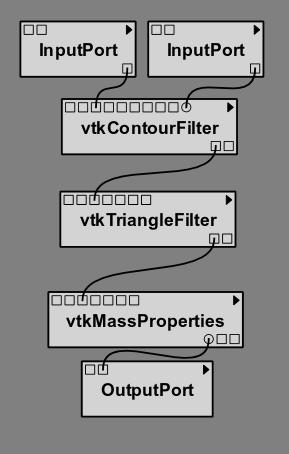
Connecting a subset of the modules to be grouped as a SubWorkflow
These modules represent the function we wish to map: each element of the input list will be processed using them. Because we have more than one module, we need to create a Group or a SubWorkflow to identify the entire function. The InputPort and the OutputPort modules are
necessary to expose these ports in the Group/SubWorkflow
structure.
Next Step!
In this example, we will use a SubWorkflow structure. Select all the modules shown in Figure Connecting a subset of the modules to be grouped as a SubWorkflow, go to the Workflow menu, and then click on Create SubWorkflow. You can name it CalculateArea. Enable the self output port in the ‘outputs’ panel: you will need it to connect to the “Map” module
Note
When using Map, the module (or subworkflow) used as function port in the map module MUST be a function, i.e., it can only define 1 output port.
Next Step!
Now, select the MplSource module and open its configuration dialog. Inside it, add two input ports of type List: “InputList” and “X_Values”. Also, copy the code listed below, in order to create the necessary information for the 2D plot, into the source text area and save your changes.
subplot(212)

dashes = [1, 3]
xaxis = []

for i in xrange(len(InputList)):
    xaxis.append(X_Values[i][1])

l, = plot(xaxis, InputList, marker="o", markerfacecolor="red",
          markersize=7, label="IsoSurface Areas", linewidth=1.5)

l.set_dashes(dashes)
Next Step!
Next, edit the PythonSource module by adding an output port “result” of type List, copying the following code to the source text area, and saving these changes. The code will create a range of contour values that we will use as our input list.
result = []

for i in xrange(4, 256, 4):
    result.append(i)
Next Step!
It may be helpful to identify this PythonSource module by labeling it as RangeList. Connect all the modules as shown in Figure All the modules connected in the canvas.
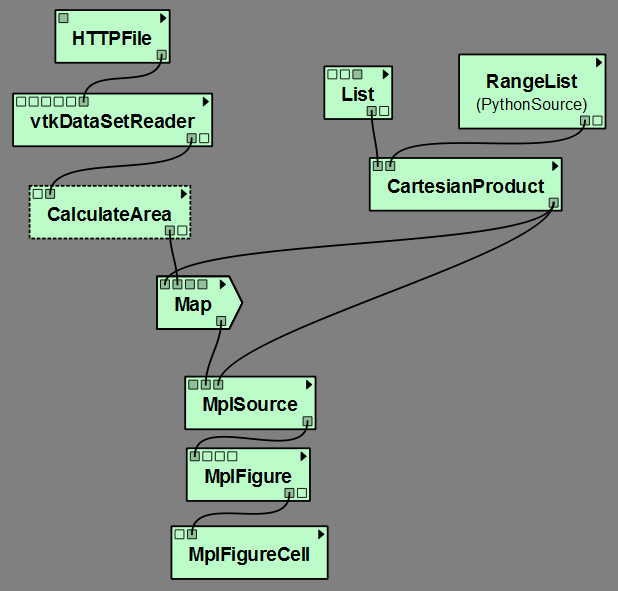
All the modules connected in the canvas
Next Step!
You will set some parameters now:
DownloadFile: set the parameter “url” to http://www.sci.utah.edu/~cscheid/stuff/head.120.vtkList: set the parameter “value” to [0]Map: set the parameter “InputPort” to [“SetValue”] and the parameter “OutputPort” to GetSurfaceArea
The workflow is now ready to be executed. When you execute the workflow, you will
see the SubWorkflow CalculateArea executing several times (one time
for each value of the input list). It’s important to notice that, although only the
module connected to Map (in this example, the SubWorkflow
Calculate Area) will be in the loop, the modules above it will be also
used in each loop iteration; the difference is that they are going to be executed
only for the first iteration; in all other iterations, the results will be taken
from the cache.
When the workflow finishes its execution, the VisTrails Spreadsheet will contain a 2D plot (Figure The result in the VisTrails Spreadsheet).
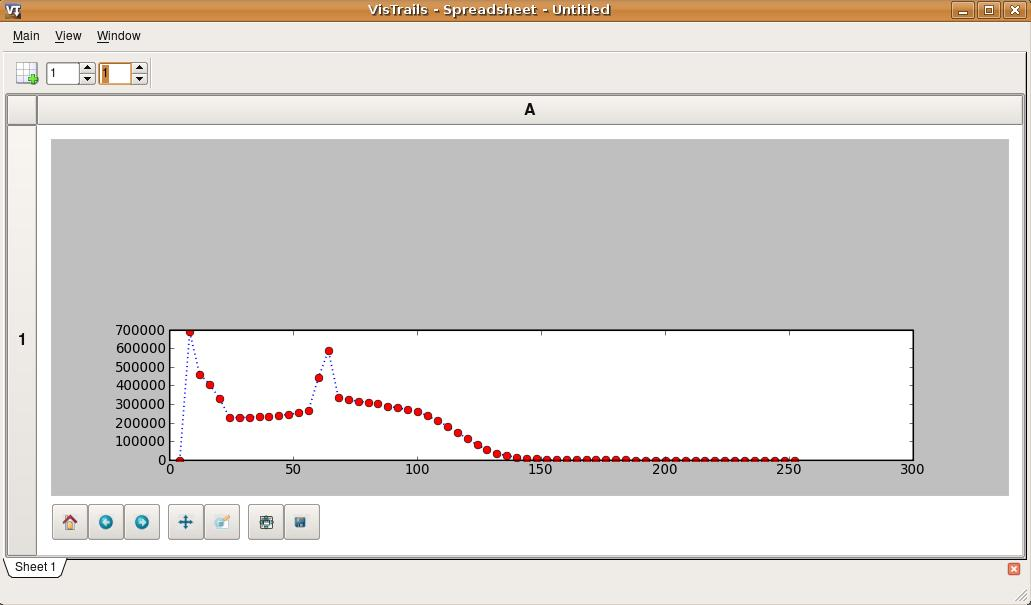
The result in the VisTrails Spreadsheet
This example can be found in the version “Surface Area with Map”, inside the triangle_area.vt vistrail.
Filtering results
When computing large lists of results, it can be useful to selectively reduce the list during execution to avoid unnecessary computation.
The Filter module was developed to address this issue. It receives an
input list and, based on a specified boolean condition, returns only elements of
the list that satisfy the condition. Its ports are the same as those in the
Map module. The difference between these modules is related to the
function module: in Filter, the output of that module is not the value to
keep, but a boolean indicating whether to keep (True) or discard
(False) the value from the original list.
Try it Now!
To better understand how Filter works, let’s modify our earlier example to filter out areas less than 200,000. With the previous vistrail open (you can use the “Surface Area with Map” version), add the following modules to the canvas:
FilterPythonSource(under “Basic Modules”)
Edit the configuration of PythonSource by adding an input port of type Float named “Area”, and an output port of type Boolean named “Condition”, and writing the following code inside the source text area:
if Area > 200000.00:
    Condition = True
else:
    Condition = False
Next Step!
Press the OK button. You can label this PythonSource as FilterCondition. Now, reorganize the modules in the canvas as shown in Figure The new organization of the modules in the canvas.
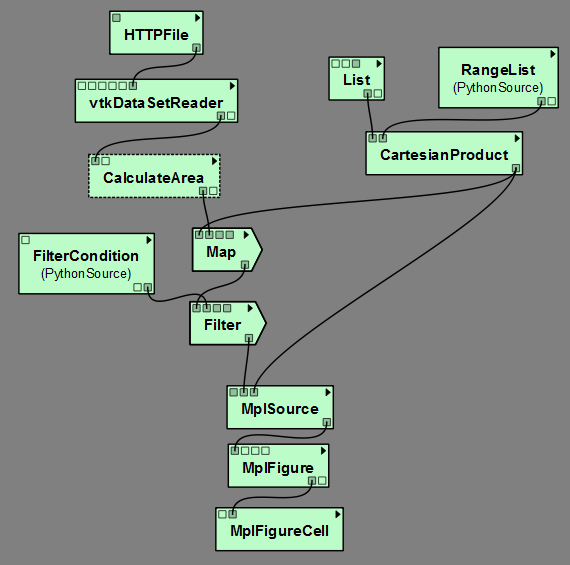
The new organization of the modules in the canvas
Next Step!
Select the Filter module and set the values of its parameters to the following:
- “InputPort”: [“Area”]
- “OutputPort”: Condition
When you execute this workflow, it will generate another plot that is similar to the one from the Map example, but only areas above 200,000 are considered (Figure The result in the VisTrails spreadsheet).
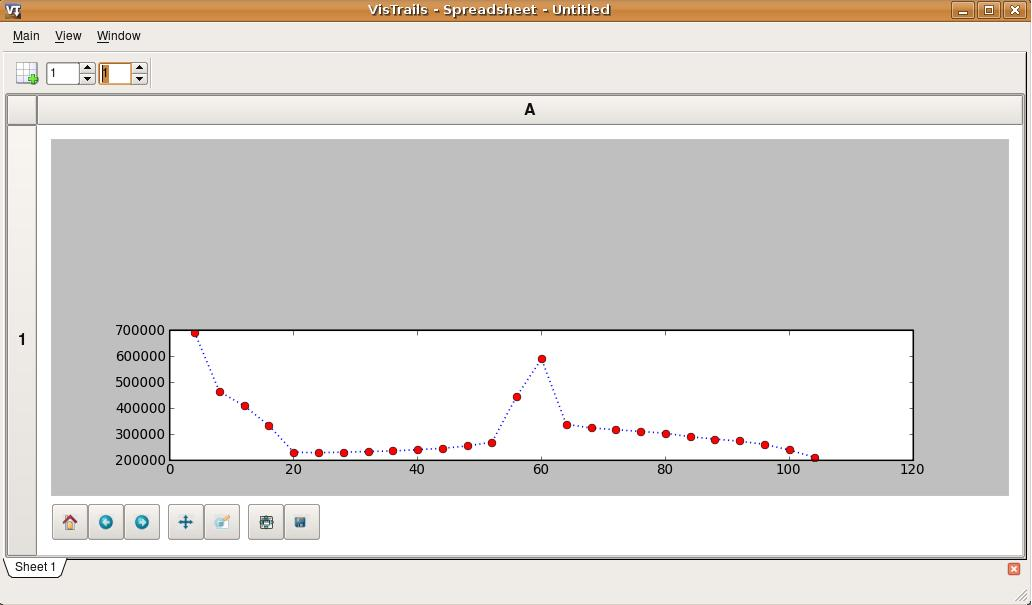
The result in the VisTrails spreadsheet
This example is already inside the triangle_area.vt vistrail, in the “Surface Area with Map and Filter” version.
Later in this chapter, you will see how to combine Map and Filter
in one single module, by creating your own control structure.
Conditional module
Conditional statements are a very important control flow structure frequently used
in programming languages, and the if structure is probably the most
common of these structures. In scientific workflows, for example, an if
structure can be used to select the part of the pipeline to be executed based on a
boolean condition.
For this reason, the Control Flow package also includes an If
module. Its input ports are:
- “Condition”: this port receives a boolean value that will specify the direction of computation;
- “TruePort”: this port receives the part of the workflow that will be executed if the condition value is
True; you don’t need to group or make a SubWorkflow in this case: just connect the output port “self” of the last module in this port; - “FalsePort”: this port receives the part of the workflow that will be executed if the condition value is
False; as with the - “TruePort” port, you don’t need to group or make a SubWorkflow;
- “TrueOutputPorts”: this port receives a list that contains the names of the output ports of the module connected to “TruePort” that you want the result of; this port is optional;
- “FalseOutputPorts”: this port receives a list that contains the names of the output ports of the module connected to “FalsePort” that you want the result of; this port is optional.
The If module has an output port named “Result” that returns a
list with the results of the specified output ports of “TrueOutputPorts” or
“FalseOutputPorts”, depending on the condition value. If only one output
port is chosen, the result of this port will not be returned in a list. If
“TrueOutputPorts” or “FalseOutputPorts” are not enabled,
“Result” returns None.
Let’s do a simple example to show how this module works.
Try it Now!
Our example will contain 2 different text strings.
The string that is used by the workflow will depend on the condition of the If module.
The final text will be rendered in a spreadsheet cell.
You can change the final text by changing the condition on the If module.
Create a new workflow and add the following modules:
Boolean(under “Basic Modules”)String(under “Basic Modules”) - you will need two of themIf(under “Control Flow”)WriteFile(under “Basic Modules”)RichTextCell(under “VisTrails Spreadsheet”)
Name the Boolean module “Condition”, the first String module
“True Branch”, and the second String module “False Branch”.
Connect the modules as shown in Figure Simple If example.
The Condition should be connected to the “Condition” port on the If
module and will determine which of the branches that will be executed.
True Branch should be connected to the “TruePort” on the If module
and will be executed when the If module evaluates to True.
False Branch should be connected to the “FalsePort” on the If
module and will be executed when the If module evaluates to False.
On the If module, set parameters “TrueOutputPorts” and “FalseOutputPorts”
to “[‘value’]”. This will tell the If module to output the “value” port on the
String modules.
Finally, set the “value” port on the Condition module to either True or
False. Execute the workflow and see that the branch specified by the
If condition has been executed.
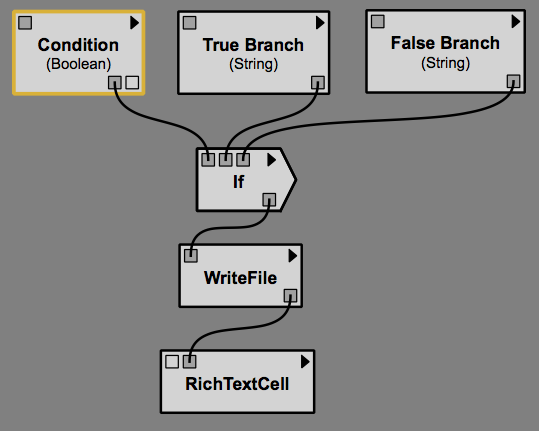
Simple If example
Lets do a more advanced example from the bioinformatics domain. This workflow
will take a string as the input. If this string is a structure identifier, a
web service from the European Bioinformatics Institute - EBI (http://www.ebi.ac.uk/)
is used to put the structure into PDB format (a standard representation for
macromolecular structure) and the VTK package is used to show the protein in
the VisTrails Spreadsheet. Otherwise, the input is assumed to be invalid and a
message is generated in the Spreadsheet.
Try it Now!
First, the EBI’s web service must be enabled. For this, you need to add the following url to the wsdlList configuration:
http://www.ebi.ac.uk/Tools/webservices/wsdl/WSDbfetch.wsdl
Don’t forget to ensure that the SudsWebServices package is enabled in the Preferences dialog. For more information about web services in VisTrails, see Chapter Example: Web Services.
Now, you’re going to drag the following modules to the canvas:
IffetchData(under “Methods” for the current web service)WriteFile(under “Basic Modules”)vtkPDBReader(under “VTK”)vtkDataSetMapper(under “VTK”)vtkActor(under “VTK”)vtkRenderer(under “VTK”)VTKCell(under “VTK”)PythonSource(under “Basic Modules”) - you will need two of themString(under “Basic Modules”)RichTextCell(under “VisTrails Spreadsheet”)
Set some paremeters of fetchData:
- “format”: pdb
- “style”: raw
Next, connect some modules as shown in Figure Some modules of the workflow connected.
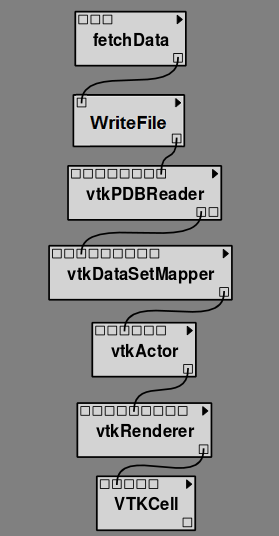
Some modules of the workflow connected
The aim of this group of modules is to get the PDB format of the structure ID, through the web service,
and then make the visualization with the VTK package. This is the part of the workflow
that will be executed if the input is a structure identifier.
Next Step!
Next, select one of the PythonSource modules and open its configuration dialog. One input port named “Structure”, of type String, and one output port named “Is_ID”, of type Boolean, must be added, as well as the code below:
1 2 3 4 5 6 7 8 9 10 11 12 13 14 15 16 | if "\n" in Structure:
lineLen = Structure.index("\n")
else:
lineLen = -1
if lineLen < 1:
lineLen = len(Structure)
if ":" in Structure:
index = Structure.index(":")
else:
index = -1
if Structure[0] != "ID " and index > 0 and index < lineLen:
Is_ID = True
else:
Is_ID = False
|
Next Step!
Name this module as Is_ID. This module will be the condition for the If structure.
Now, select the last PythonSource module, and, inside its configuration, add one input port of type String, named “Input”, and one output port of type File, named “html”. Then, copy the code below:
1 2 3 4 5 6 7 8 9 10 11 12 13 14 15 16 17 | output = self.interpreter.filePool.create_file()
f = open(str(output.name), 'w')
text = '<HTML><TITLE>Protein Visualization</TITLE><BODY BGCOLOR="#FFFFFF">'
f.write(text)
text = '<H2>Protein Visualization Workflow</H2>'
f.write(text)
text = '<H3>The following input is not an ID from a protein:</H3>'
text += '<H4>' + Input + '</H4>'
text += '<H3>The visualization cannot be done.</H3>'
f.write(text)
text = '</BODY></HTML>'
f.write(text)
self.set_output('html', f)
f.close()
|
Next Step!
Name this PythonSource as Not_ID. This module will print a message in the VisTrails Spreadsheet when the input is not a structure identifier.
Finally, the String module can be named as Workflow_Input, to make it clear that it takes the input of the workflow. Also, open the configuration dialog of RichTextCell to enable the output port “self”, so it can be connected to the If module. Then, connect all the modules as shown in Figure All the modules connected.
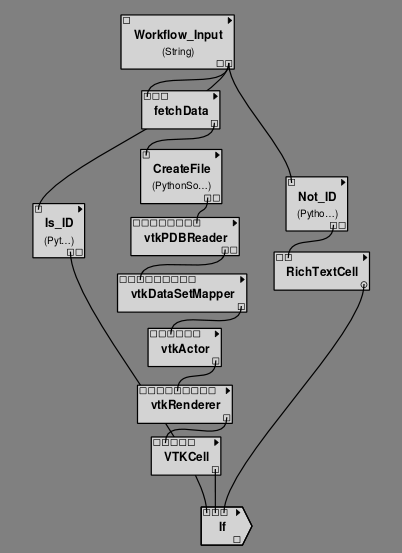
All the modules connected
Next Step!
In order to better organize the disposal of the modules, group all the modules shown in Figure Some modules of the workflow connected by selecting them, going to the Edit menu and clicking on Group. Name it as Generate_Visualization. Your workflow must correspond to the one shown in Figure The final workflow, using the Group structure.
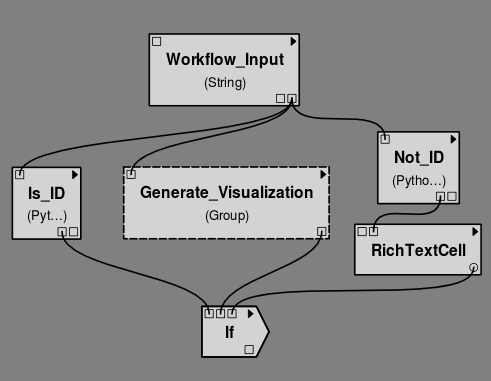
The final workflow, using the Group structure
Note that this implementation follows exactly the initial specification of the workflow. If the input
is a structure identifier (Is_ID returns True), Generate_Visualization
will be executed; otherwise (Is_ID returns False), Not_ID
and RichTextCell will create an error message in the VisTrails Spreadsheet.
Next Step!
For the workflow execution, set the parameter “value” of the Workflow_Input module to PDB:3BG0. This entry is an ID from a protein; so, the condition will be True, and the Generate_Visualization group will be executed, generating the visualization shown in Figure The visualization of the protein in the VisTrails Spreadsheet.
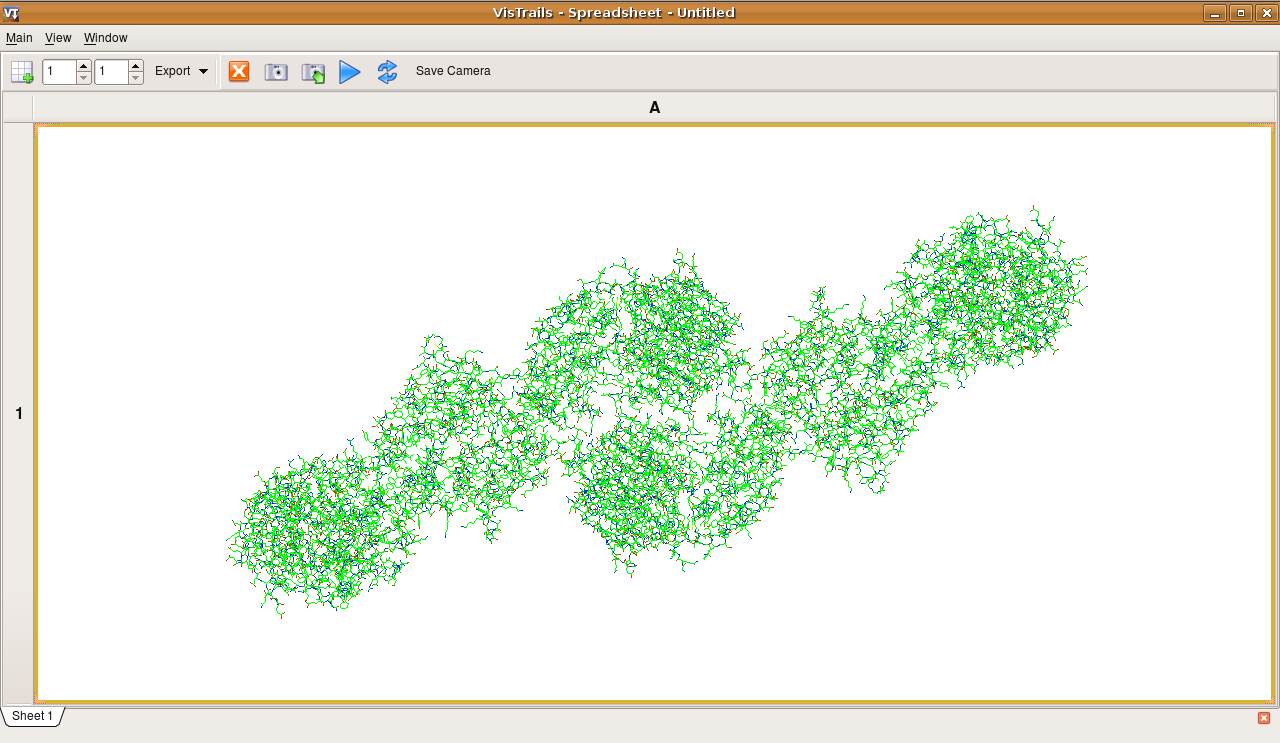
The visualization of the protein in the VisTrails Spreadsheet
If you change the value from the input port “value” to protein, for example, the
condition will be False, and the message shown in
Figure The message in the Spreadsheet, generated when the input is not a structure ID will be generated in the Spreadsheet.
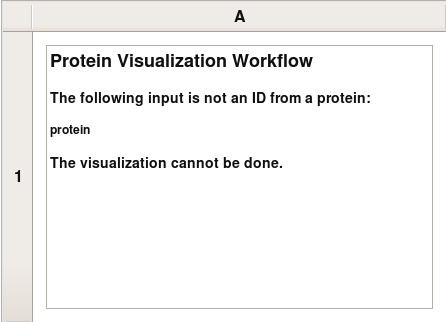
The message in the Spreadsheet, generated when the input is not a structure ID
This example can be found inside the “examples” directory, in the protein_visualization.vt vistrail. It was partially based on the workflow “Structure_or_ID”, which can be found at http://www.myexperiment.org/workflows/225.
While loop
The while loop is a common construct of programming languages, allowing the repetition of an operation until some condition becomes true.
It runs a single module (possibly a Group or Subworkflow) whose self output
port is connected to the FunctionPort input of the While module (just
like the Map module). It gets the value of the ports whose name are set on
the ConditionPort, OutputPort and StateOutputPorts. As long as the port
designated by ConditionPort does not return true, the module is run again, with
on its StateInputPorts the values that were output on the StateOutputPorts in
the previous run.
Try it Now!
In this example, we are going to compute the GCD of two integers using Euclid’s algorithm. Keep in mind that VisTrails is meant for data-oriented workflows and that we are twisting it’s execution model a little, but this will demonstrate the functionality should you actually need it.
Note that you can find the completed example here: gcd.vt.
The modules we are going to need are:
AndInputPort(under “Basic Modules”)List(under “Basic Modules”)PythonSource(under “Basic Modules”)- 3
OutputPort(under “Basic Modules”)- 2
Tupleand oneUntuple(under “Basic Modules”)- 2
PythonCalc(under “PythonCalc”)- 2
If
The structure is a little complicated and comports 4 parts (see Figure The grouped pipeline for Euclid’s algorithm):
- (I) compares a and b, and outputs the biggest one as ‘result’
- (II) makes the (a, b-a) Tuple (if a < b)
- (III) is like (II) but makes (a-b, b) (if a >= b)
- (IV) sets the ‘continue’ port, if both a and b are not null.
The Integer modules marked ‘a’ and ‘b’ are only here to make the workflow
clearer, they simply repeat the values from Untuple.
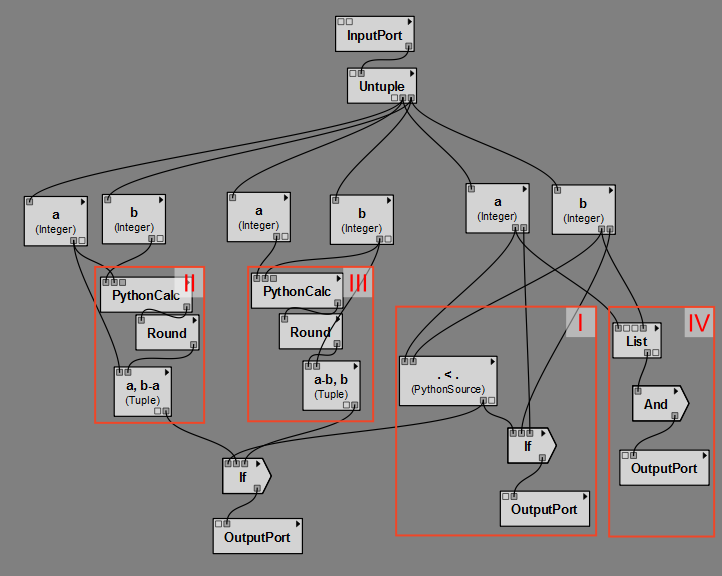
The grouped pipeline for Euclid’s algorithm
Next Step!
The PythonCalc are substractions (operation ‘-‘).
The PythonSource has two Integer inputs a and b, and a Boolean o
output; the code should be o = a < b
The Tuple and Untuple modules have two Integer ports each.
You will need to use the List module’s configuration widget to add one
additional port, so you can connect a and b to the head and
item0 ports.
The If modules each have ['value'] for both FalseOutputPorts and
TrueOutputPorts.
Next Step!
Set names on the InputPort and OutputPort modules. For example, you
can use nbs for the InputPort and (from left to right) state,
result and continue for the OutputPort.
Once this is done, you can simply select everything and Workflow/Group.
Then, add a While module, fill in the port names, and set the nbs
port of the Group to 15 and 6 (or any couple of integers). Also add a
StandardOutput module to display the result.
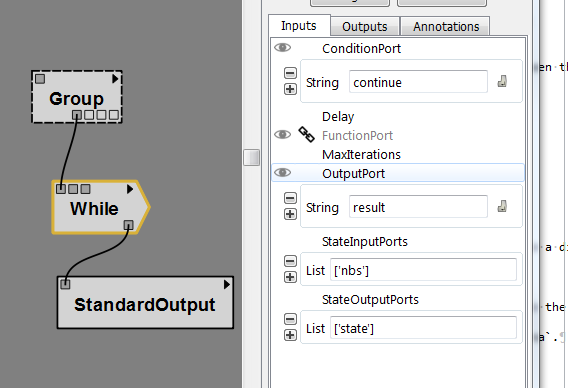
The final pipeline
For loop
The For module is very similar to Map, except that it uses input values
from a range. It can be used to make a module or group run several times with
successive integer input, or just to repeatedly execute a task (optionally
waiting between each iteration).
Boolean operations
The And and Or modules are simple boolean operations. They take a list
of booleans and output a single boolean. They are useful when building
workflows with structures that need booleans, such as the Filter, While
and If modules.
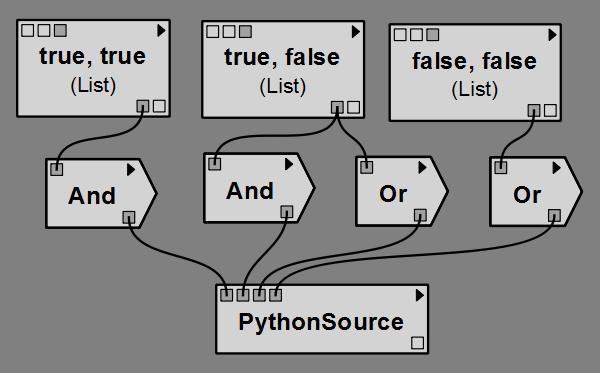
Example usage of And and Or modules; outputs (True, False, True, False)
Vector operations
This packages also provides some general modules for lists, or vectors of numbers.
The Sum module computes the sum of the elements in a list of numbers.
Example: Sum([1, 2, 3]) = 6
The Cross module takes two 3-element lists and computes the cross product
of these vectors. It returns a 3-element list as well.
Example: Cross([1, 2, -1], [0, 2, 5]) = [12, -5, 2]
The Dot module performs the dot product of two lists, i.e. returns the sum
of the pairwise products of the two lists’ elements. It is the same thing as
connecting an ElementwiseProduct to a Sum module.
Example: Dot([2, 0, -1], [4, 2, 3]) = 5
If NumericalProduct is true (the default), the ElementwiseProduct
module outputs a list where each element is the product of the elements of both
input lists.
Example: ElementwiseProduct([1, 2, 3], [2, 0, -1]) = [2, 0, -3]
Else, the elements are concatenated instead of multiplied.
Example: ElementwiseProduct([1, 2, 3], [2, 0, -1]) =
[(1, 2), (2, 0), (3, -1)]