Difference between revisions of "SciVisFall2008/Assignment 0"
| Line 55: | Line 55: | ||
range from 0.02 to 1. Choose to generate 6 steps in | range from 0.02 to 1. Choose to generate 6 steps in | ||
a single horizontal row of the spreadsheet. Press | a single horizontal row of the spreadsheet. Press | ||
"Execute". As a result you should 6 isosurfaces | "Execute". As a result you should 6 isosurfaces in the | ||
spreadsheet. Identify the "red" one, and add it to the | |||
version tree. This can be done by going into the "View" menu on the spreadsheet, | |||
Identify the " | |||
can be done by going into the "View" menu on the spreadsheet, | |||
and clicking on the "Create Version" icon in the spreadsheet | and clicking on the "Create Version" icon in the spreadsheet | ||
cell showing the blue isosurface. The history tree should have | cell showing the blue isosurface. The history tree should have | ||
a new node that you should tag "Problem | a new node that you should tag "Problem 4". (You can change | ||
the spreadsheet back to interactive mode by using the "View" | the spreadsheet back to interactive mode by using the "View" | ||
menu again.) | menu again.) | ||
=== Problem 5: matplotlib === | === Problem 5: matplotlib === | ||
Revision as of 20:26, 8 September 2008
Problem 1: query by tag, execute, annotate, query by example and prune history
To make sure you know how to search versions in the history tree of Vistrails do the following simple task:
1) In the History view locate the version tagged "EX1". Execute this version and annotate it with the name that appears in the visualization.
2) Query by Example Delaunay
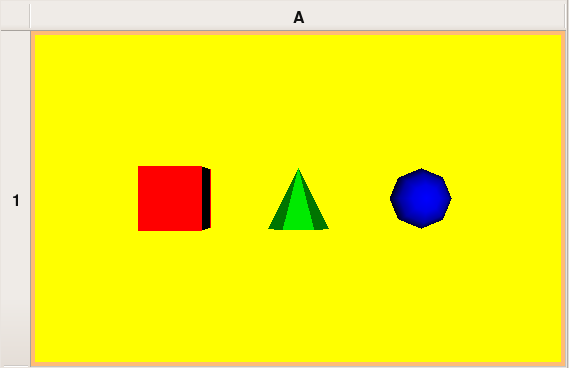
Problem 2: pipeline from an image
From the root version on the history tree design a pipeline to reproduce the image below.
Tag the version with the resulting pipeline with label "Problem 2".
Problem 3: pipeline from C++ code
Starting from the root version on the history tree design a pipeline that is equivalent to the C++ source contQuad.cxx.
Tag the version of the resulting pipeline with label "Problem 3".
Problem 4: parameter exploration
Find the version tagged "spx" in the history tree. Execute this version and play with the resulting visualization. The goal is to generate several isosurfaces of this model using the parameter exploration feature of Vistrails.
First a modification in the "spx" pipeline is necessary to be able to extract a single isosurface of the model. Here are the steps: (1) modify the "spx" pipeline by inserting a "vtkContourFilter" in the middle of the connection from "vtkUnstructuredGridReader" to "vtkDataSetMapper" and (2) select the new "vtkContourFilter" and use the "SetValue" method with parameters 0 (Integer) and 0.5 (Float) to extract the isosurface of value 0.5 from the model. Execute this pipeline and you should see a green isosurface.
With the "modified-from-spx" pipeline selected in the history tree go to the "Exploration" view of Vistrails. On the right side of the screen you should see the text "SetValue(0,0.5)". Drag this text to the middle of the screen. Now, for the Float parameter, select the range from 0.02 to 1. Choose to generate 6 steps in a single horizontal row of the spreadsheet. Press "Execute". As a result you should 6 isosurfaces in the spreadsheet. Identify the "red" one, and add it to the version tree. This can be done by going into the "View" menu on the spreadsheet, and clicking on the "Create Version" icon in the spreadsheet cell showing the blue isosurface. The history tree should have a new node that you should tag "Problem 4". (You can change the spreadsheet back to interactive mode by using the "View" menu again.)
