Tabular data package
The tabledata package provides facilities to load and manipulate data in table formats.
It provides modules to read tables from CSV files and numpy arrays (including plain binary files) and extract or convert columns.
Try it Now!
This example shows how to use tabledata together with matplotlib to visualize trip data from NYC Citibike’s open data.
Note that you can find the completed example here: bikes.vt.
Start by dragging the following modules to the canvas:
DownloadFile(from the URL package)CSVFile(underread/csv)TableCell- Two
ExtractColumnmodulesStringToDates(underconvert/dates)MplLinePlotfrom the matplotlib packageMplFigurefrom the matplotlib packageMplFigureCellfrom the matplotlib package
Connect the modules as shown in Figure The pipeline for the Bikes example.
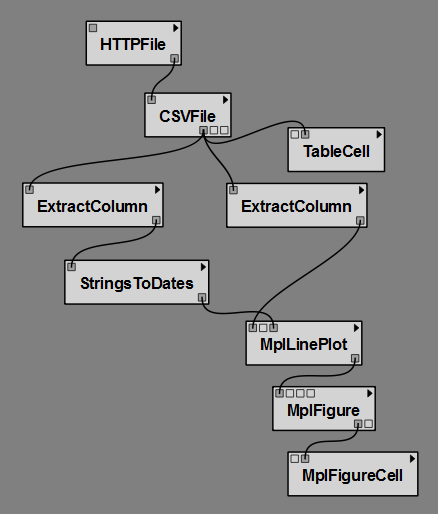
The pipeline for the Bikes example
Next Step!
Set the ‘url’ input of DownloadFile to http://www.vistrails.org/download/download.php?type=DATA&id=citibike_from_launch.csv.
Make sure ‘header_present’ is checked on CSVFile.
Set the ‘column_name’ parameters on both ExtractColumn modules to Date (for the one on the left) and Miles traveled today (midnight to 11:59 pm) (for the one on the right). Alternatively, you can set column_index to 0 and 3.
The workflow is now ready. On execution, you will see a graphical view of the CSV file as a table, and a line plot showing the variations of the total distance traveled daily.
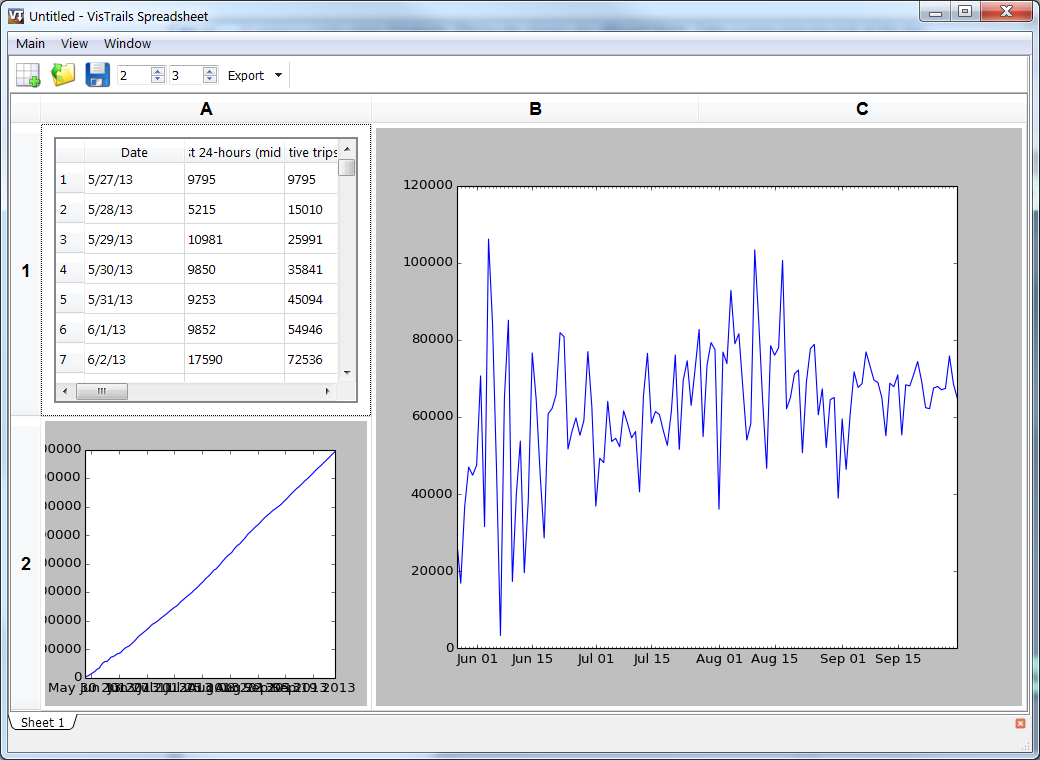
The result in the VisTrails Spreadsheet