Difference between revisions of "User:Tohline/vtk/Examples/LegacyBUstructuredPoints"
(Begin description of Boston University example of Structured Points) |
|||
| Line 2: | Line 2: | ||
{{LSU_HBook_header}} | {{LSU_HBook_header}} | ||
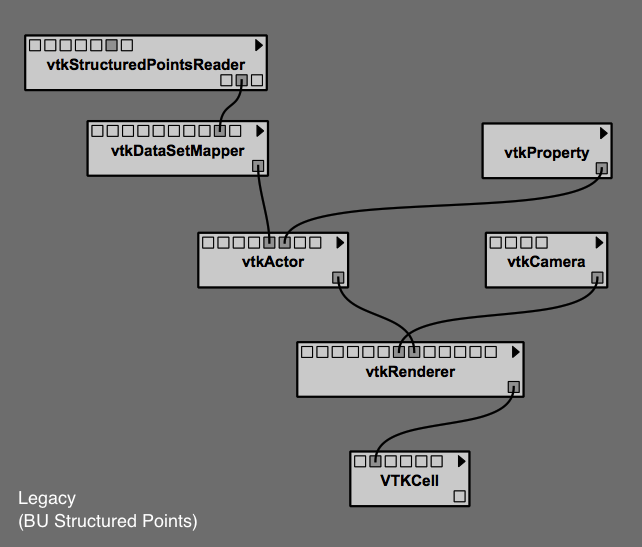
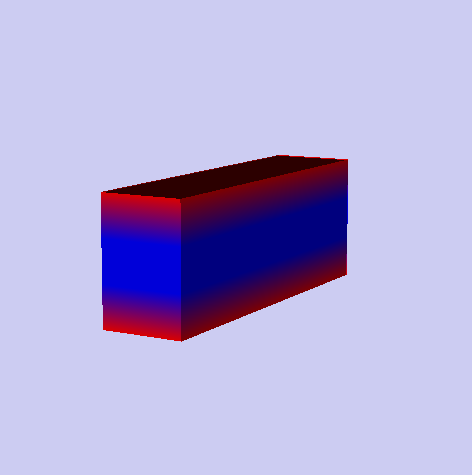
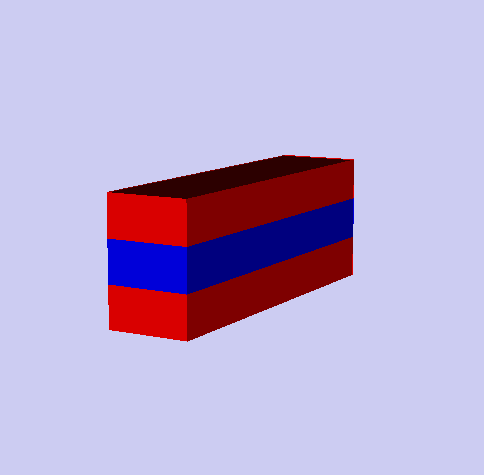
This is | This is an example input data file that has been developed based on the structured-points illustration that I found in a tutorial powerpoint presentation posted (circa 2010) [http://www.bu.edu/tech/files/2010/10/VTK-Fall-2010.ppt by Robert Putnam on a Boston University website]; see especially slides 22-25. The file illustrates VTK's ''Simple Legacy Format'' and the STRUCTURED_POINTS dataset format. To aid in implementation, we present the full ascii dataset, two resulting rendered images, and a screen shot of the VisTrails pipeline that was used to generate the image. Note that the image captioned "Point Data" was generated, by default, while the image captioned "Cell Data" was generated after activating the ''SetScalarModeToUseCellData'' method within the '''vtkDataSetMapper''' module. A list of other example input data files [[User:Tohline/vtk/SimpleCubeTutorial#Other_Example_Input_Files_and_VisTrails_Pipelines|is provided near the end of our accompanying ''Simple Cube Tutorial'']]. | ||
==Legacy | ==Legacy STRUCTURED_POINTS Example== | ||
<div align="left"> | <div align="left"> | ||
| Line 38: | Line 38: | ||
<tr> | <tr> | ||
<td align="center" rowspan="2"> | <td align="center" rowspan="2"> | ||
[[Image: | [[Image:BUstructuredPointsPipeline.png|right|thumb|500px|Structured Points]] | ||
</td> | </td> | ||
<td align="center"> | <td align="center"> | ||
[[Image: | [[Image:ScreenshotPoints.png|right|thumb|200px|Point Data Image]] | ||
</td> | </td> | ||
</tr> | </tr> | ||
<tr> | <tr> | ||
<td align="center"> | <td align="center"> | ||
[[Image: | [[Image:ScreenshotCells.png|right|thumb|200px|Cell Data Image]] | ||
</td> | </td> | ||
</tr> | </tr> | ||
| Line 57: | Line 57: | ||
** [[User:Tohline/vtk/SimpleCubeTutorial/CubeDetails#Cube_Definition_Details|Specifying Points (Vertices) and Polygons]] of a cube | ** [[User:Tohline/vtk/SimpleCubeTutorial/CubeDetails#Cube_Definition_Details|Specifying Points (Vertices) and Polygons]] of a cube | ||
** [[User:Tohline/vtk/ColorLookupTablea#Color_Lookup_Tables|Defining Color Lookup Tables]] | ** [[User:Tohline/vtk/ColorLookupTablea#Color_Lookup_Tables|Defining Color Lookup Tables]] | ||
* [http://www.bu.edu/tech/files/2010/10/VTK-Fall-2010.ppt Robert Putnam's (Boston University) powerpoint tutorial] -- includes a ''Structured_Points'' example, written in Simple Legacy Format | |||
Latest revision as of 17:18, 18 April 2014
Example Input Files & VisTrails Pipelines

|
|---|
| | Tiled Menu | Tables of Content | Banner Video | Tohline Home Page | |
This is an example input data file that has been developed based on the structured-points illustration that I found in a tutorial powerpoint presentation posted (circa 2010) by Robert Putnam on a Boston University website; see especially slides 22-25. The file illustrates VTK's Simple Legacy Format and the STRUCTURED_POINTS dataset format. To aid in implementation, we present the full ascii dataset, two resulting rendered images, and a screen shot of the VisTrails pipeline that was used to generate the image. Note that the image captioned "Point Data" was generated, by default, while the image captioned "Cell Data" was generated after activating the SetScalarModeToUseCellData method within the vtkDataSetMapper module. A list of other example input data files is provided near the end of our accompanying Simple Cube Tutorial.
Legacy STRUCTURED_POINTS Example
# vtk DataFile Version 1.0
Boston University example
ASCII
DATASET STRUCTURED_POINTS
DIMENSIONS 3 4 5
ORIGIN 0 0 0
SPACING 1 1 2
CELL_DATA 24
SCALARS temp-cell float
LOOKUP_TABLE default
0 0 1 1 0 0
0 0 1 1 0 0
0 0 1 1 0 0
0 0 1 1 0 0
POINT_DATA 60
SCALARS temp-point float
LOOKUP_TABLE default
0 0 0 1 1 1 1 1 1 0 0 0
0 0 0 1 1 1 1 1 1 0 0 0
0 0 0 1 1 1 1 1 1 0 0 0
0 0 0 1 1 1 1 1 1 0 0 0
0 0 0 1 1 1 1 1 1 0 0 0
Related Discussions
- Other examples of properly formatted input data files
- Simple Cube Tutorial
- Robert Putnam's (Boston University) powerpoint tutorial -- includes a Structured_Points example, written in Simple Legacy Format


