Control Flow in VisTrails
Scientific workflows usually follow a dataflow model, but, in some cases, control structures, including loops and conditionals, are necessary to accomplish certain tasks. VisTrails provides the Control Flow package to support these and other structures.
The Map operator
In functional programming, map is a high-order function that applies a given function to a list (each element of the list is processed using this function) and returns a sequence of results. The Map module provides this functionality for workflows in VisTrails. Note that this module provides simple looping as it can be used to iterate through a list of inputs.
In order to use the Map module, a ListOfElements
type representing a list of data structure is also provided. Two additional
modules help users combine elements of lists: Dot combines the
elements of two lists like the dot product (the first element of the first list
is combined with the first of the second one, the second element of the first
list is combined with the second of the second one, and so on), and
Cross combines the elements as the cross product (all the possible
combinations between the elements of the lists); both modules return a list of
tuples. In addition to two lists of elements as input ports, they take an
optional boolean input named “CombineTuple”. This input is useful
when one or both input lists have tuples as elements; if this port is selected,
and its value is False, the elements of the list will not be
combined in just one tuple, e.g., (1, 2) + 3  ((1, 2), 3); otherwise, the elements will be combined, e.g., (1, 2) + 3 (1, 2, 3).
The Map module has four input ports:
- “FunctionPort”: this port receives the module (via the “self” output port) that represents the function to be applied for each element of the input list; if the function uses more than one module, you must use a Group (see Chapter Creating and Modifying Workflows) or a SubWorkflow and connect that composite module to this port;
- “InputPort”: this port receives a list of the names of the input ports that represent the individual arguments of the function;
- “OutputPort”: this port receives the name of the output port that represents the individual result of the function;
- “InputList”: this port receives the input list for the loop; it must be a list of tuples if more than one function input port was chosen.
The output port “Result” produces a list of results, one for each element in the input list.
To better show how to use the Map module, let’s use a workflow as an example. Inside the “examples” directory of the VisTrails distribution, open the “triangle_area.vt” vistrail. Now, select the “Surface Area” version. This version basically calculates the area of a given isosurface. We are going to modify this version, in order to calculate the areas of the isosurface given by contour values in a list. Then, we will create a 2D plot to show all the areas.
Begin by deleting the StandardOutput module, and the connection between the vtkDataSetReader and the vtkContourFilter modules. Then, drag the following modules to the canvas:
- Map
- ListOfElements
- Cross
- MplPlot (under “matplotlib”)
- MplFigure (under “matplotlib”)
- MplFigureCell (under “matplotlib”)
- InputPort (under “Basic Modules”) - you will need two of them
- OutputPort (under “Basic Modules”)
- PythonSource (under “Basic Modules”)
Notice that when you drag Map to the pipeline canvas it will be drawn in a different shape from the other modules. This is a visual cue to help distinguish control modules from other modules. All control modules have the same shape.
Select the vtkContourFilter module and delete its method “SetValue” in the Set Methods container. Then, open its configuration dialog (you can use the “Ctrl-E” or “Command-E” keyboard shortcut) and enable this method (the input port “SetValue”) by clicking on it, and pressing OK.
Then, connect the modules as shown in Figure Connecting a subset of the modules to be grouped as a SubWorkflow.
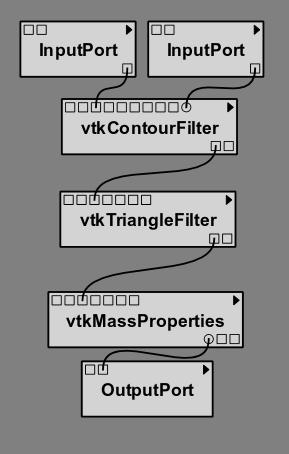
Connecting a subset of the modules to be grouped as a SubWorkflow
These modules represent the function we wish to map: each element of the input list will be processed using them. Because we have more than one module, we need to create a Group or a SubWorkflow to identify the entire function. The InputPort and the OutputPort modules are necessary to expose these ports in the Group/SubWorkflow structure.
In this example, we will use a SubWorkflow structure. Select all the modules shown in Figure Connecting a subset of the modules to be grouped as a SubWorkflow, go to the Edit menu, and then click on Make SubWorkflow. You can name it CalculateArea. Select this SubWorkflow and open its configuration. When the configuration dialog opens, enable the output port “self” and press OK. You will need this port to connect to the Map module.
Note
When using Map, the module (or subworkflow) used as function port in the map module MUST be a function, i.e., it can only define 1 output port.
Now, select the MplPlot module and open its configuration dialog. Inside it, add two input ports of type ListOfElements: “InputList” and “X_Values”. Also, copy the code listed below, in order to create the necessary information for the 2D plot, into the source text area and save your changes using the OK button.
subplot(212)

dashes = [1, 3]
list1 = self.getInputFromPort("InputList")
list2 = self.getInputFromPort("X_values")
list3 = []

for i in xrange(len(list1)):
    list3.append(list2[i][1])

l, = plot(list3, list1, marker="o", markerfacecolor="red",
     markersize=7, label="IsoSurface Areas", linewidth=1.5)

l.set_dashes(dashes)
Next, edit the PythonSource module by adding an output port “List” of type ListOfElements, copying the following code to the source text area, and saving these changes. The code will create a range of contour values that we will use as our input list.
result = []

for i in xrange(4, 256, 4):
    result.append(i)

self.setResult("List", result)
It may be helpful to identify this PythonSource module by labeling it as RangeList. Connect all the modules as shown in Figure All the modules connected in the canvas.
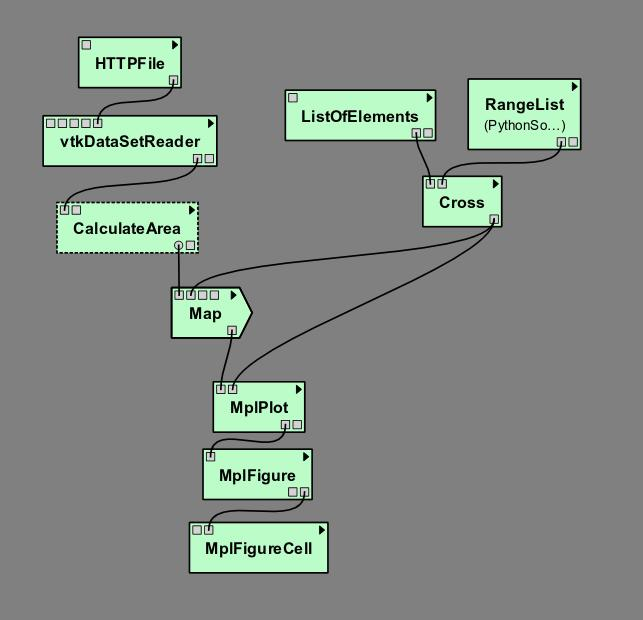
All the modules connected in the canvas
You will set some parameters now:
- HTTPFile: set the parameter “url” to http://www.sci.utah.edu/~cscheid/stuff/head.120.vtk
- ListOfElements: set the parameter “value” to [0]
- Map: set the parameter “InputPort” to [“SetValue”] and the parameter “OutputPort” to GetSurfaceArea
The workflow is now ready to be executed. When you execute the workflow, you will see the SubWorkflow CalculateArea executing several times (one time for each value of the input list). It’s important to notice that, although only the module connected to Map (in this example, the SubWorkflow Calculate Area) will be in the loop, the modules above it will be also used in each loop iteration; the difference is that they are going to be executed only for the first iteration; in all other iterations, the results will be taken from the cache.
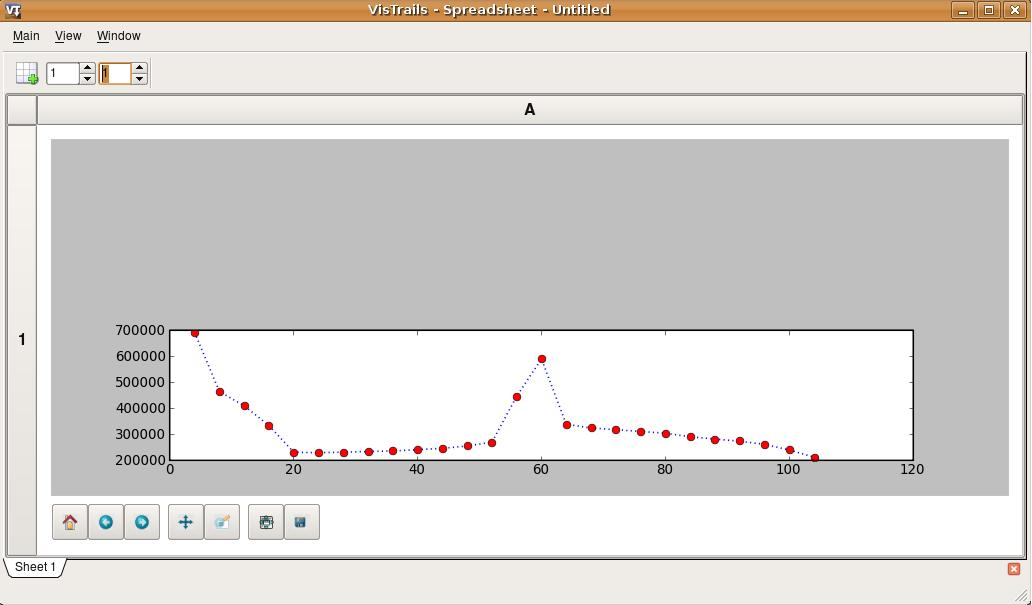
When the workflow finishes its execution, the VisTrails Spreadsheet will contain a 2D plot (Figure The result in the VisTrails Spreadsheet).
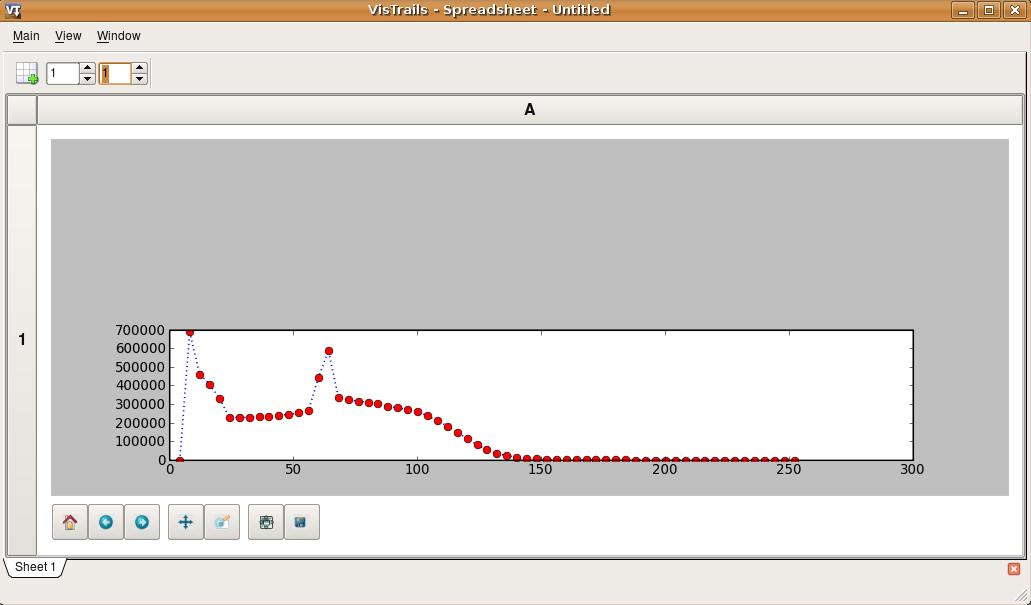
The result in the VisTrails Spreadsheet
This example can be found in the version “Surface Area with Map”, inside the “triangle_area.vt” vistrail.
Filtering results
When computing large lists of results, it can be useful to selectively reduce the list during execution to avoid unnecessary computation.
The Filter module was developed to address this issue. It receives an input list and, based on a specified boolean condition, returns only elements of the list that satisfy the condition. Its ports are the same as those in the Map module. The difference between these modules is related to the structure: in Filter, the output port “FunctionPort” cannot receive any function, but only a condition; in other words, the selected port in “OutputPort” must return a boolean value or Filter will not work. Thus, Filter will not return a list with boolean values as Map would do, but rather the elements of the input list for which the condition evaluated to True.
To better understand how Filter works, let’s modify our earlier example to filter out areas less than 200,000. With the previous vistrail open (you can use the “Surface Area with Map” version), add the following modules to the canvas:
- Filter
- PythonSource (under “Basic Modules”)
Edit the configuration of PythonSource by adding an input port of type Float named “Area”, and an output port of type Boolean named “Condition”, and writing the following code inside the source text area:
area = self.getInputFromPort("Area")

if area>200000.00:
    self.setResult("Condition", True)
else:
    self.setResult("Condition", False)
Press the OK button. You can label this PythonSource as FilterCondition. Now, reorganize the modules in the canvas as shown in Figure The new organization of the modules in the canvas.
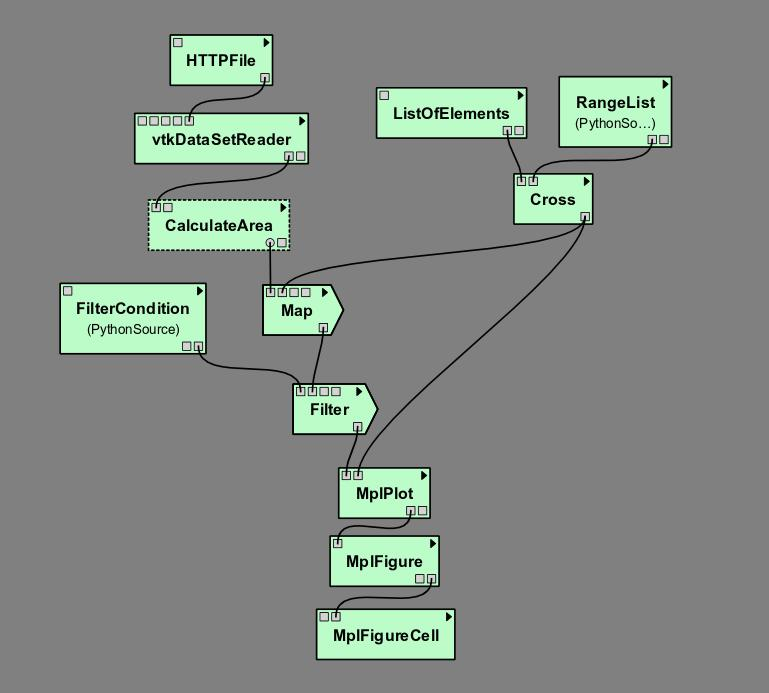
The new organization of the modules in the canvas
Select the Filter module and set the values of its parameters to the following:
- “InputPort”: [“Area”]
- “OutputPort”: Condition
When you execute this workflow, it will generate another plot that is similar to the one from the Map example, but only areas above 200,000 are considered (Figure The result in the VisTrails spreadsheet).
The result in the VisTrails spreadsheet
This example is already inside the “triangle_area.vt” vistrail, in the “Surface Area with Map and Filter” version.
Later in this chapter, you will see how to combine Map and Filter in one single module, by creating your own control structure.
Conditional module
Conditional statements are a very important control flow structure frequently used in programming languages, and the if structure is probably the most common of these structures. In scientific workflows, for example, an if structure can be used to select the part of the pipeline to be executed based on a boolean condition.
For this reason, the Control Flow package also includes an If module. Its input ports are:
- “Condition”: this port receives a boolean value that will specify the direction of computation;
- “TruePort”: this port receives the part of the workflow that will be executed if the condition value is True; you don’t need to group or make a SubWorkflow in this case: just connect the output port “self” of the last module in this port;
- “FalsePort”: this port receives the part of the workflow that will be executed if the condition value is False; as with the
- “TruePort” port, you don’t need to group or make a SubWorkflow;
- “TrueOutputPorts”: this port receives a list that contains the names of the output ports of the module connected to “TruePort” that you want the result of; this port is optional;
- “FalseOutputPorts”: this port receives a list that contains the names of the output ports of the module connected to “FalsePort” that you want the result of; this port is optional.
The If module has an output port named “Result” that returns a list with the results of the specified output ports of “TrueOutputPorts” or “FalseOutputPorts”, depending on the condition value. If only one output port is chosen, the result of this port will not be returned in a list. If “TrueOutputPorts” or “FalseOutputPorts” are not enabled, “Result” returns None.
Let’s do now a simple example to show how exactly this module works. This example is from the bioinformatics domain, and takes a string as the input; if it’s a structure identifier, a web service from the European Bioinformatics Institute, or simply EBI (http://www.ebi.ac.uk/), a centre of researchs in bioinformatics, is used to get the structure in the PDB format, a standard representation for macromolecular structure, and then, the VTK package is used to show the protein in the VisTrails Spreadsheet; otherwise, the input is assumed to be invalid, and a message is generated in the Spreadsheet too.
First, the EBI’s web service must be enabled. For this, you need to add the following url to the wsdlList configuration:
http://www.ebi.ac.uk/Tools/webservices/wsdl/WSDbfetch.wsdl
Don’t forget to ensure that the webServices package is enabled in the Preferences dialog. For more information about web services in VisTrails, see Chapter Example: Web Services.
Now, you’re going to drag the following modules to the canvas:
- If
- fetchData (under “Methods” for the current web service)
- vtkPDBReader (under “VTK”)
- vtkDataSetMapper (under “VTK”)
- vtkActor (under “VTK”)
- vtkRenderer (under “VTK”)
- VTKCell (under “VTK”)
- PythonSource (under “Basic Modules”) - you will need three of them
- String (under “Basic Modules”)
- RichTextCell (under “VisTrails Spreadsheet”)
Select one of the PythonSource modules, and open its configuration dialog. Inside it, add one input port of type String, named “PDB_format”, and one output port of type File, named “File”. Then, write the following code:
1 2 3 4 5 6 7 8 9 | PDB_format = self.getInputFromPort('PDB_format')
output = self.interpreter.filePool.create_file()
file_ = open(str(output.name), 'w')
file_.write(PDB_format)
self.setResult('File', file_)
file_.close()
|
You can name this module as CreateFile. Now, set some paremeters of fetchData:
- “format”: pdb
- “style”: raw
Next, connect some modules as shown in Figure Some modules of the workflow connected.
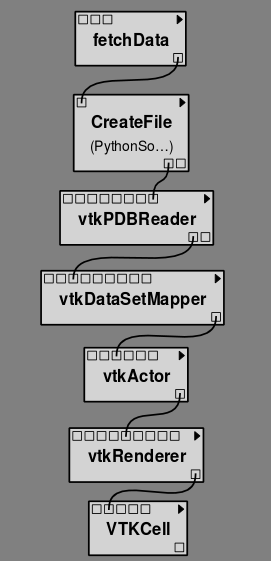
Some modules of the workflow connected
The aim of this group of modules is to get the PDB format of the structure ID, through the web service, and then make the visualization with the VTK package. This is the part of the workflow that will be executed if the input is a structure identifier.
Next, select another PythonSource module and open its configuration dialog too. One input port named “Structure”, of type String, and one output port named “Is_ID”, of type Boolean, must be added, as well as the code below:
1 2 3 4 5 6 7 8 9 10 11 12 13 14 15 16 17 18 | if"\n" in structure:
lineLen = structure.index("\n")
else:
lineLen = -1
if lineLen<1:
lineLen = len(structure)
if ":" in structure:
index = structure.index(":")
else:
index = -1
if (structure[0]!="ID ") and (index>0) and (index<lineLen):
is_ID = True
else:
is_ID = False
self.setResult("Is_ID", is_ID)
|
Name this module as Is_ID. This module will be the condition for the If structure.
Now, select the last PythonSource module, and, inside its configuration, add one input port of type String, named “Input”, and one output port of type File, named “html”. Then, copy the code below:
1 2 3 4 5 6 7 8 9 10 11 12 13 14 15 16 17 18 19 | input = self.getInputFromPort("Input")
output = self.interpreter.filePool.create_file()
f = open(str(output.name), 'w')
text = '<HTML><TITLE>Protein Visualization</TITLE><BODY BGCOLOR="#FFFFFF">'
f.write(text)
text = '<H2>Protein Visualization Workflow</H2>'
f.write(text)
text = '<H3>The following input is not an ID from a protein:</H3>'
text += '<H4>' + str(input) + '</H4>'
text += '<H3>The visualization cannot be done.</H3>'
f.write(text)
text = '</BODY></HTML>'
f.write(text)
self.setResult('html', f)
f.close()
|
Name this PythonSource as Not_ID. This module will print a message in the VisTrails Spreadsheet when the input is not a structure identifier.
Finally, the String module can be named as Workflow_Input, to make it clear that it takes the input of the workflow. Also, open the configuration dialog of RichTextCell to enable the output port “self”, so it can be connected to the If module. Then, connect all the modules as shown in Figure All the modules connected.
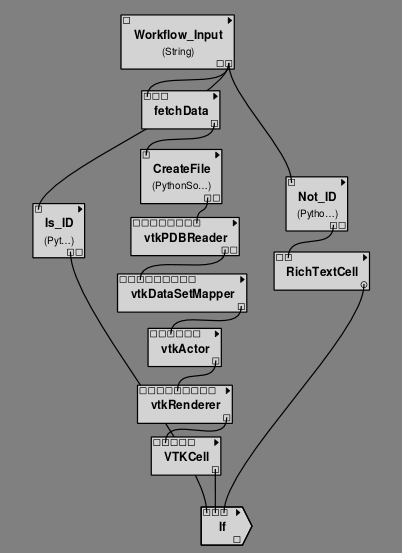
All the modules connected
In order to better organize the disposal of the modules, group all the modules shown in Figure Some modules of the workflow connected by selecting them, going to the Edit menu and clicking on Group. Name it as Generate_Visualization. Your workflow must correspond to the one shown in Figure The final workflow, using the Group structure.
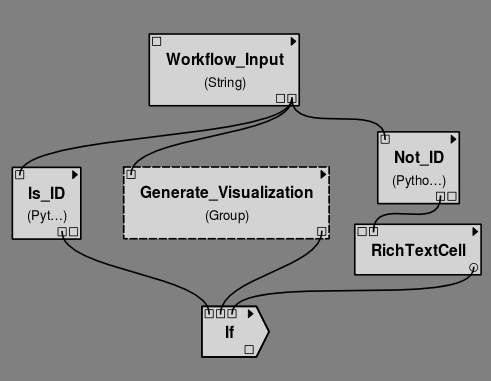
The final workflow, using the Group structure
Note that this implementation follows exactly the initial especification of the workflow. If the input is a structure identifier (Is_ID returns True), Generate_Visualization will be executed; otherwise (Is_ID returns False), Not_ID and RichTextCell will create an error message in the VisTrails Spreadsheet.
For the workflow execution, set the parameter “value” of the Workflow_Input module to PDB:3BG0. This entry is an ID from a protein; so, the condition will be True, and the Generate_Visualization group will be executed, generating the visualization show in Figure The visualization of the protein in the VisTrails Spreadsheet.
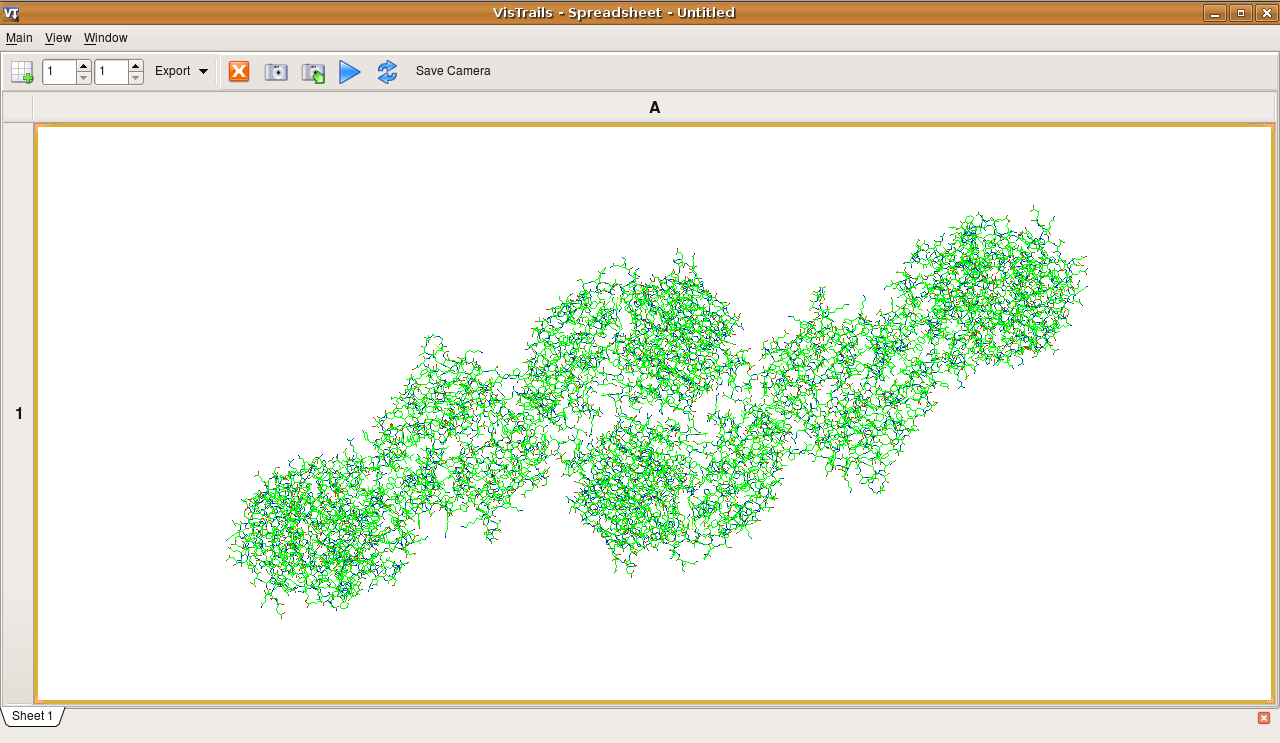
The visualization of the protein in the VisTrails Spreadsheet
If you change the value from the input port “value” to protein, for example, the condition will be False, and the message shown in Figure The message in the Spreadsheet, generated when the input is not a structure ID will be generated in the Spreadsheet.
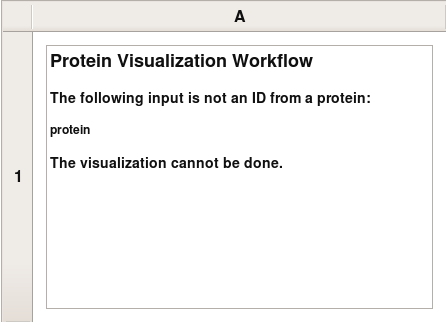
The message in the Spreadsheet, generated when the input is not a structure ID
This example can be found inside the “examples” directory, in the “protein_visualization.vt” vistrail. It was partially based on the workflow “Structure_or_ID”, which can be found at http://www.myexperiment.org/workflows/225.